October 16, 2023
I believe technology can truly help in building positive habits. On Moocable, one of the biggest challenges is to ensure learners stick to their goals.
There are numerous UI/UX features that hook users and help build habits. I often ask people about an app or feature that has personally helped them maintain consistency or progress. In this post, I want to talk about one notable example: Calendar Heatmaps.
Few visualizations are so intuitive and insightful as calendar heatmaps are at presenting user logs/actions/habits. It could be because they combine two familiar visualizations: color coding and calendars.
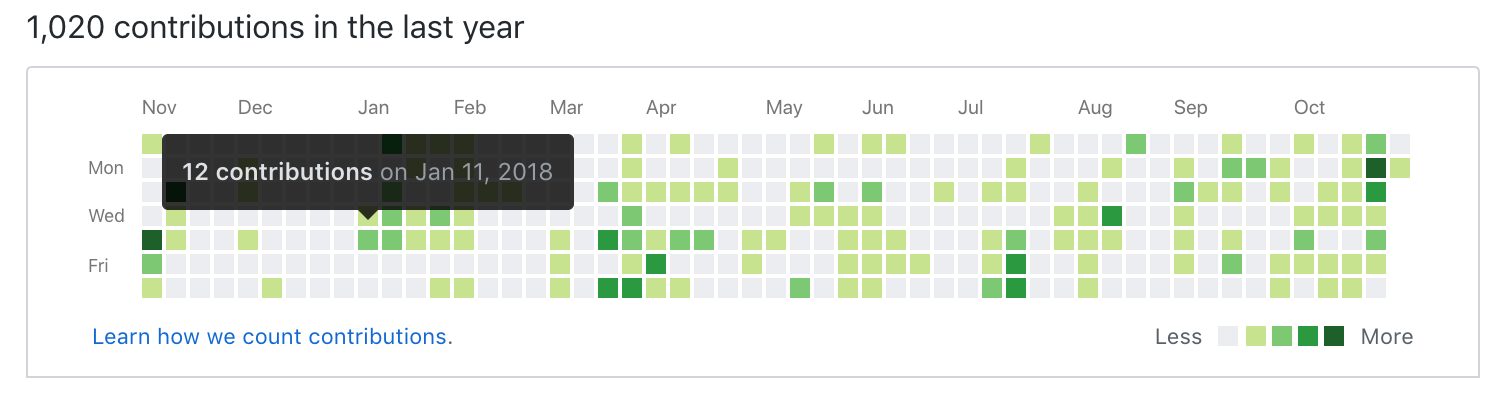
If you have ever been to GitHub, you would have definitely stumbled across the chart shown below
The tiles' color represents the number of contributions (as described by the legend at the bottom right of the chart). Calendar heatmap provides a visually appealing way to visualize over days in a calendar-like view, making it easy to identify daily patterns or anomalies.
Calendar heatmaps are a great habit-tracking feature. You can find them in fitness apps (like Apple Fitness), journaling apps, and most habit-tracking. They are handy, because:
- It creates a visual cue that can remind you to act.
- It is motivating to see the progress you are making. You don’t want to break your streak.
- It feels satisfying to record your success in the moment.
Have you ever noticed that most calendar heatmaps use the color green to display data? Turns out there’s a reason behind that.
Humans can perceive some colors as stimulating and others as relaxing:
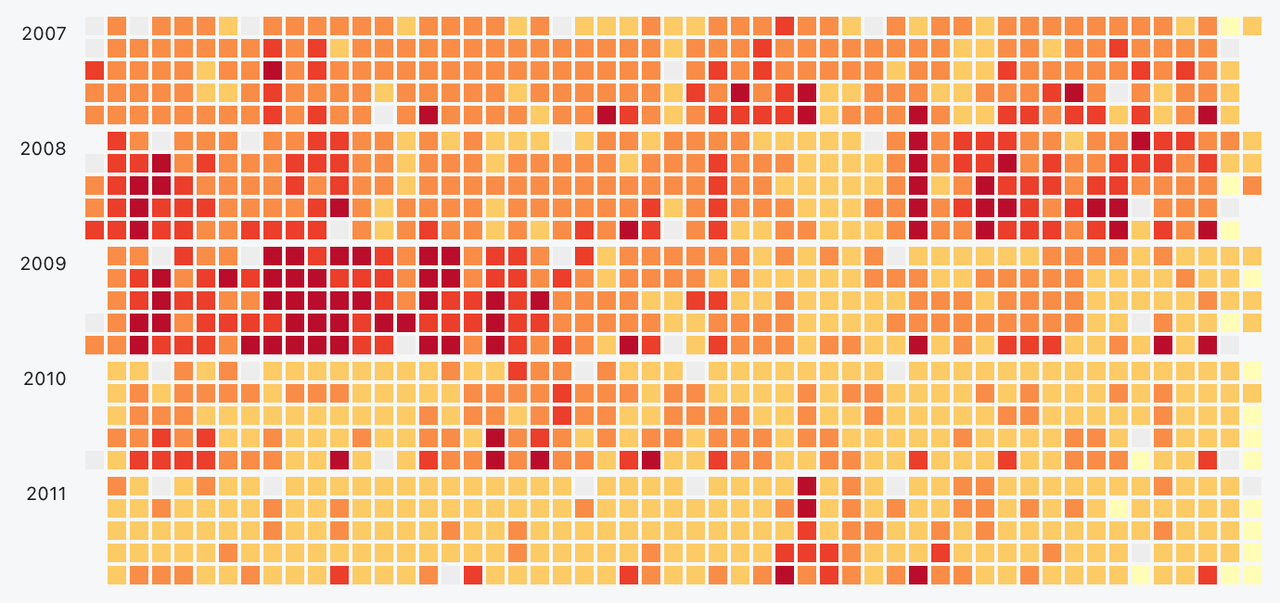
- The red-to-yellow part of the spectrum activates the sympathetic nervous system, which causes a fight-or-flight response: the heart rate increases, blood sugar rises, the blood supply to the muscles increases, and all senses heighten.
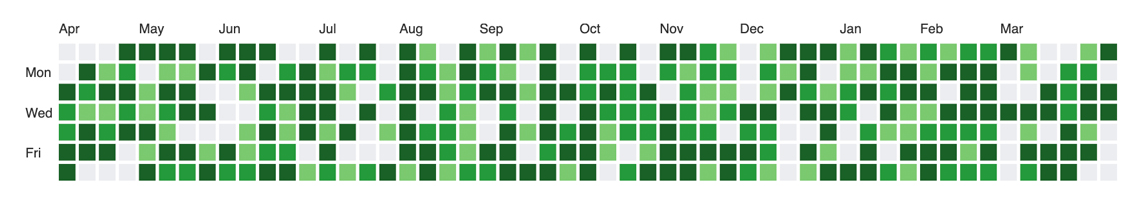
- Blue-to-green, on the other hand, suppresses the sympathetic nervous system while activating the parasympathetic nervous system. This sends the body a signal to rest and relax: pulse and breathing slow down and digestion starts.
A general guide to choosing the right colors for your calendar heatmap:
🔴 Red – important tasks, urgent events, deadlines.
🟡 Yellow/orange – brainstorming sessions, creative workshops.
🟢 Green – your daily tasks, and routine.
🔵 Blue – lunch, coffee breaks.
Scrimba offers ~20 free courses on HTML, CSS, JS, and React.
If you are interested, check out 20+ Free Scrimba Courses
Calendar Heatmap provides a sense of progress. Seeing a box fill up every time you achieve your goal reinforces the behavior (makes it more likely to want to do it again).
When we get a signal that we are moving forward, we become more motivated to continue down that path. In this way, calendar heatmaps can have an additive effect on motivation. Each small win feeds your desire.
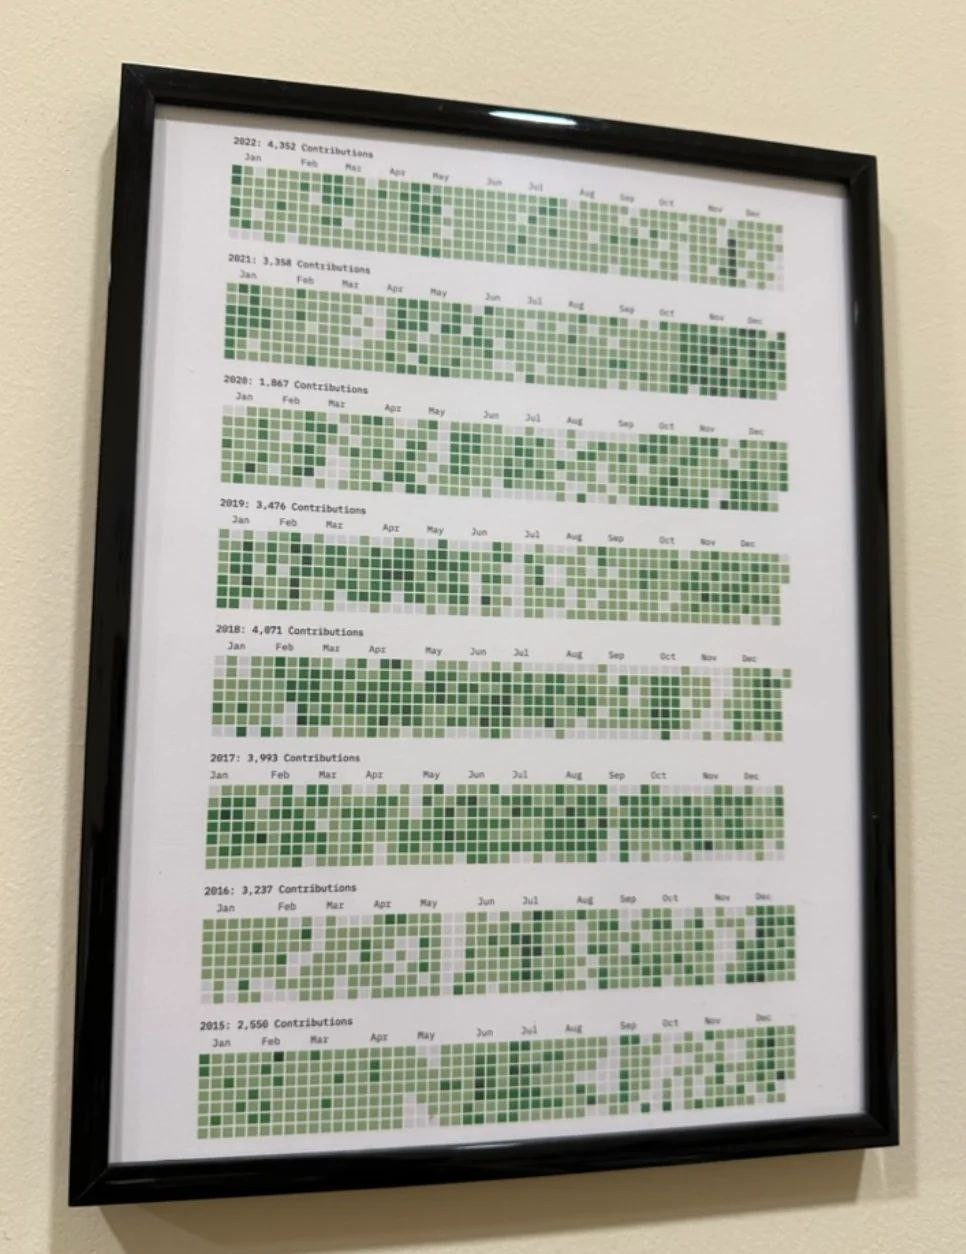
And in the long run, a larger number can fill you with a sense of pride and achievement in that you’ve managed to maintain a streak for so long.
Calendar heatmaps often visualize user actions/tasks. At any stage, you know exactly how close you are to your next achievement. It’s rare that goals are communicated to us in such a tangible and easy-to-understand manner. This can be a powerful motivator.
Research indicates that people are more likely to continue doing something when their recent repetition of that behavior is logged and highlighted to them.
People go to great lengths to maintain these “streaks” because they deem it to be a meaningful goal in and of itself, independent of what they hope to achieve – keeping fit, learning a new language, etc. – from repeating the behavior in the first place.
Calendar heatmap lets you see how regularly you practice your habit. You may notice that some days you skip it, while other days you perform it more successfully. This gives you an idea of your progress and motivates you to keep up the effort.
If you are using a heatmap, where each habit/task is assigned a unique color, you might gain correlating insights about your habits.
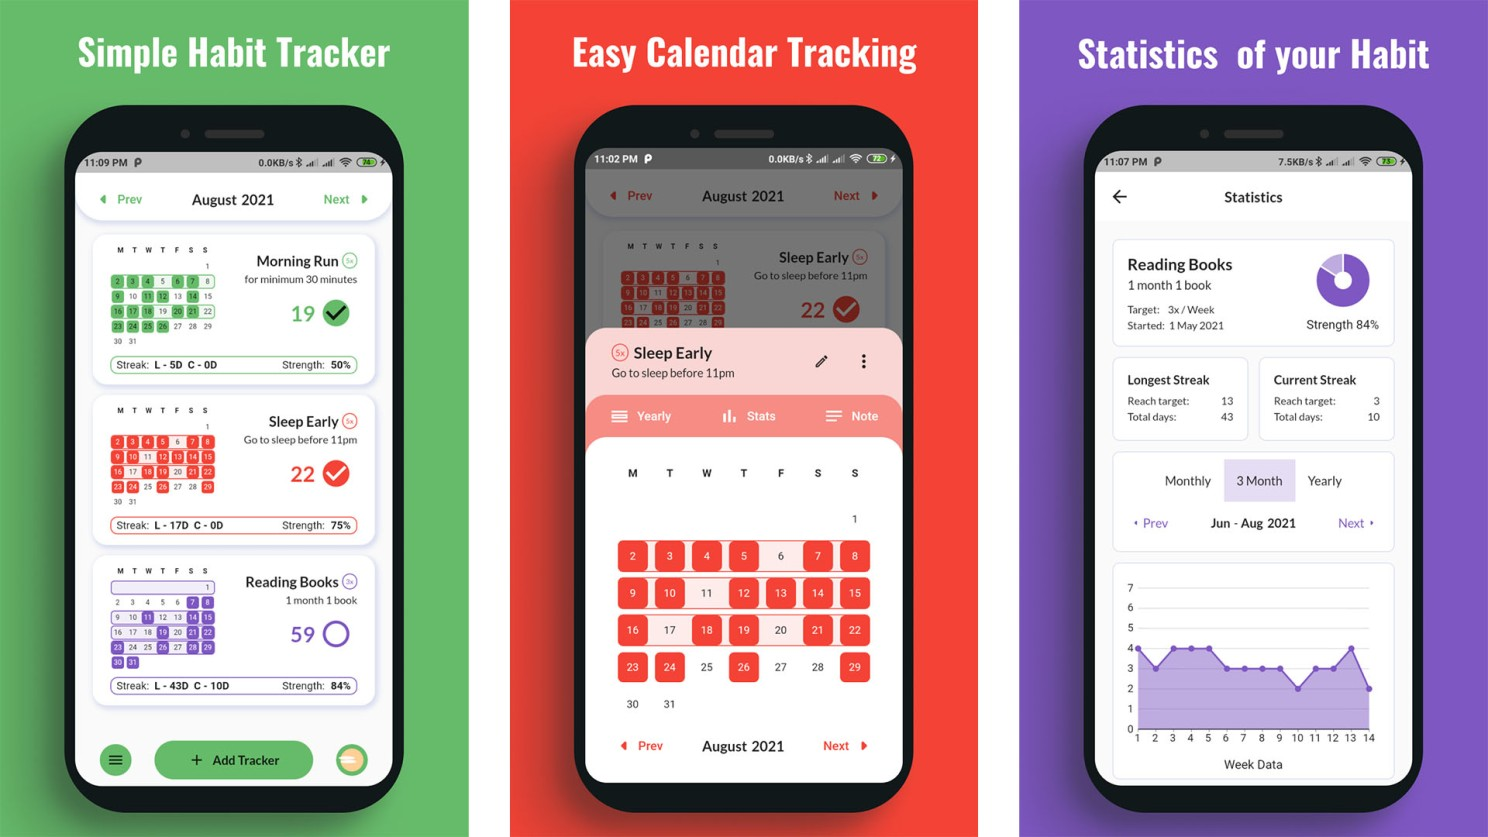
From the above image, you can understand how the user spends certain days running, and other days reading books.
A streak represents effort and investment into an activity we value. In other words, streaks are as susceptible to the endowment effect — the psychological perception by which we think anything in our possession is worth more than it actually is. Because we build a sense of ownership another important psychological mechanism follows: aversion.
Calendar Heatmap is a fun and simple feature, but committing yourself to keeping one is also one of the best ways to stay on track with your learning goals. You can use a habit-tracking app or physically sketch a calendar to keep track of your progress.
Studying books/online courses alone is difficult. That's why I'm building Moocable - a gamified cohort-based platform. Now you can study that Coursera course with your friends!